Showing posts with label x. Show all posts
Showing posts with label x. Show all posts
26 March 2007
X and steel
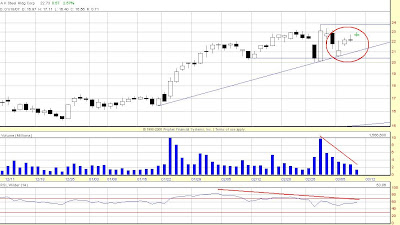
i noticed this chart over the weekend. check out the negative divergence between price and rsi, even at barely new highs... volume at these new highs is weak too. now today, monday, it gapped up at the opening. if volume is big today and x closes at new highs, that would be very bullish. volume sucks and/or it closes weak, keep an eye on it for short. also, there may be buyout rumors circulating in the steel sector in general.


08 March 2007
making the case for shorting steel
steel has been one strong sucker lately, but i believe we can see some cracks in its armor (no pun intended). please consider the following and then get back to me... thanks.
AKS
ATI

X

AKS
- first check out the crappy gapping around here at the top in the red circle. tops are often plagued by squirrelly action like this
- for the last few days or so, notice the negative divergence between price and volume - as price is gapping up, the volume is decreasing
- with an indicator like rsi, we like to see the rsi go up with price, and a divergence like in this case often signal tops, or temporary tops before pullbacks, corrections, or what have you

- check out the red circles - they show ATI making a new high on horrible volume
- the blue circle shows that same crappy gapping
- finally, with both volume and rsi, we see negative divergence with price

- green circle shows bounce off of short term trend line; however, the red circles highlight falling below that line and then 2 failed attempts at breaking back above it before gapping down
- the purple circles show new high on horrible volume
- don't forget the crappy gapping in the blue circle
- and finally don't forget your negative divergences

Subscribe to:
Posts (Atom)