Volume, the Mysterykeep reading here.
By Nigel Hawkes, President, Hawkeye Traders
Many thousands of words have been written on volume over the years, but its secrets elude many traders. Until a trader has a full understanding and appreciation of volume, though, it is my considered opinion that he or she will be making judgments that do not take into account the basic “supply and demand” of the market...
Showing posts with label price and volume. Show all posts
Showing posts with label price and volume. Show all posts
16 April 2007
v o l u m e
i try to observe stock trading volume in an attempt to judge the relative strength, weakness, conviction, etc of particular price movements, especially when these movements occur close to support, resistance and trend lines. that's why i will be checking out this article:


04 April 2007
half and half
i am impressed as any permabull out there as to the price action in the dow yesterday - it moved up nice, held its gains, and then closed above resistance. however, check out the volume in the chart below. just because volume wasn't awesome doesn't mean that the dow won't continue higher, but it's just one thing to keep in mind. i've been busy hanging drywall lately, so i haven't had much time to post here. but that's changing soon. i have some good charts lined up.


26 March 2007
X and steel
i noticed this chart over the weekend. check out the negative divergence between price and rsi, even at barely new highs... volume at these new highs is weak too. now today, monday, it gapped up at the opening. if volume is big today and x closes at new highs, that would be very bullish. volume sucks and/or it closes weak, keep an eye on it for short. also, there may be buyout rumors circulating in the steel sector in general.


22 March 2007
RVBD, price and volume, and when to cover or at least not be bearish anymore
intraday post
this chart of RVBD and the red box highlights consolidation (kinda the opposite of distribution) after a multiday fall and big volume capitulation. in the red box we see big volume without the price moving much. lots of shares are changing hands with almost equal buyers and sellers. this is usually a good sign to cover and wait for a low volume bounce to a critical resistance line. in the red box we also see a tag of the blue uptrend line - this provided support too. that's why i like trendlines - when things come together like this, which they often do, you can get a good idea about what is going to happen.

this chart of RVBD and the red box highlights consolidation (kinda the opposite of distribution) after a multiday fall and big volume capitulation. in the red box we see big volume without the price moving much. lots of shares are changing hands with almost equal buyers and sellers. this is usually a good sign to cover and wait for a low volume bounce to a critical resistance line. in the red box we also see a tag of the blue uptrend line - this provided support too. that's why i like trendlines - when things come together like this, which they often do, you can get a good idea about what is going to happen.

20 March 2007
third circle to the rescue - HAL and the power of trend lines
intraday post
these two charts of HAL demonstrate the power of trend lines and trend line support. it's significant when these trend lines get broken - so keep monitoring this one. check out the volume for today so far, too!
HAL - longer term - third circle to the rescue!

HAL - shorter term

these two charts of HAL demonstrate the power of trend lines and trend line support. it's significant when these trend lines get broken - so keep monitoring this one. check out the volume for today so far, too!
HAL - longer term - third circle to the rescue!

HAL - shorter term

14 March 2007
trend line failures + chart request
these are mid-day charts so double check where they closed for the day...
i will be updating this post throughout the day - so check back often... also, if there are any charts you'd like to see, let me know.
LEH - nice volume!

ATI - keep your eye on it - it looks ready perhaps to fail again at the long term uptrend line - the yellow box discloses trend line details, and don't forget to review my previous post making the case for shorting steel.

ALL - more failing at the long term uptrend line! see all previous posting and charting on ALL here.

AAPL - potential to fail at the trend line - keep your eye on on the action in the red circle... the blue box highlights the gap down that has been filled. see all previous posts and charting on AAPL here.

BBD has behaved according to plan [see all previous BBD posting/charting here]. gap resistance highlighted by the blue box came into effect. also notice the negative divergence between price and volume highlighted by the red lines.

JOYG -red lines show negative price and volume divergence. a break of the short term trend line on decent volume could be a short signal. CAT is weak too...

i will be updating this post throughout the day - so check back often... also, if there are any charts you'd like to see, let me know.
LEH - nice volume!

ATI - keep your eye on it - it looks ready perhaps to fail again at the long term uptrend line - the yellow box discloses trend line details, and don't forget to review my previous post making the case for shorting steel.

ALL - more failing at the long term uptrend line! see all previous posting and charting on ALL here.

AAPL - potential to fail at the trend line - keep your eye on on the action in the red circle... the blue box highlights the gap down that has been filled. see all previous posts and charting on AAPL here.

BBD has behaved according to plan [see all previous BBD posting/charting here]. gap resistance highlighted by the blue box came into effect. also notice the negative divergence between price and volume highlighted by the red lines.

JOYG -red lines show negative price and volume divergence. a break of the short term trend line on decent volume could be a short signal. CAT is weak too...

OSG - here we see gap resistance at work, pathetic volume at the peak of the bounce, and finally this is good example of support/resistance lines originating at moving average crossovers [see this post] - the green line was drawn when the 50-day moving average crossed below the 200-day moving average (green circle). this line provided support before - will it hold this time?

RIMM opened up below the 50-day moving average today and at the time of this posting was still below. it hasn't been crashing with the rest of the market today - so that's one feather in the bullish camp. watch it here - its sitting on a short term trend line highlighted in blue.


RIMM opened up below the 50-day moving average today and at the time of this posting was still below. it hasn't been crashing with the rest of the market today - so that's one feather in the bullish camp. watch it here - its sitting on a short term trend line highlighted in blue.

13 March 2007
back to work - price and volume on the indexes up first...
we've been tracking price and volume on the indexes since plunge tuesday 27 feb 2007, and just as i expected - the indexes have moved higher on lower volume - not a good sign. but anything's possible. at any rate, i've been very busy loading and installing drywall for my home renovation, but the frequency and ferocity is going to pick back up starting now... all the best!


09 March 2007
coloring the QID > more price and volume mechanics > trend lines > sup/resist lines
the volume trend and explosion alone are impressive... is there anything predictive going on here?


ESRX, trend lines and the mechanics of price and volume
price and volume can be very telling. keep in mind that any one day may or may not be meaningless in the grander scheme of things. its an ongoing, iterative, analytic process.
the significance of price and volume mechanics become more important as price approaches demonstrably significant trend lines, horizontal support/resistance lines and moving averages. for example consider the chart of ESRX below. the red circles highlight yesterday's candle and corresponding volume. note the high volume along with the failure of the price to break above the downtrend line or make any appreciable and significant movement, either up or down. yes, the stock closed down for the day, but the absolute change isn't great. this indicates large turnover of stock accompanied characterized by nearly balancing amounts of selling and buying. another word for this is distribution. sustained distribution over time or at key resistance levels is very bearish and helps to build the case for shorting. no back to ESRX - why such action here? there was news recently, but i don't follow that too hard. for better or worse, i prefer to listen to the charts - but that's just me. in all honesty, i am slacking in my ability to appreciate the fundamentals. at any rate, failure to break above or below the long term downtrend line will be significant - keep it on your radars!

the significance of price and volume mechanics become more important as price approaches demonstrably significant trend lines, horizontal support/resistance lines and moving averages. for example consider the chart of ESRX below. the red circles highlight yesterday's candle and corresponding volume. note the high volume along with the failure of the price to break above the downtrend line or make any appreciable and significant movement, either up or down. yes, the stock closed down for the day, but the absolute change isn't great. this indicates large turnover of stock accompanied characterized by nearly balancing amounts of selling and buying. another word for this is distribution. sustained distribution over time or at key resistance levels is very bearish and helps to build the case for shorting. no back to ESRX - why such action here? there was news recently, but i don't follow that too hard. for better or worse, i prefer to listen to the charts - but that's just me. in all honesty, i am slacking in my ability to appreciate the fundamentals. at any rate, failure to break above or below the long term downtrend line will be significant - keep it on your radars!

08 March 2007

making the case for shorting steel
steel has been one strong sucker lately, but i believe we can see some cracks in its armor (no pun intended). please consider the following and then get back to me... thanks.
AKS
ATI

X

AKS
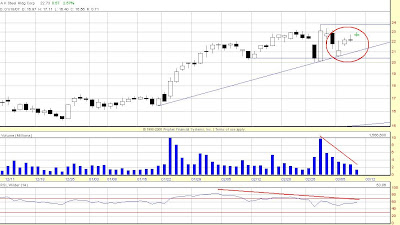
- first check out the crappy gapping around here at the top in the red circle. tops are often plagued by squirrelly action like this
- for the last few days or so, notice the negative divergence between price and volume - as price is gapping up, the volume is decreasing
- with an indicator like rsi, we like to see the rsi go up with price, and a divergence like in this case often signal tops, or temporary tops before pullbacks, corrections, or what have you

- check out the red circles - they show ATI making a new high on horrible volume
- the blue circle shows that same crappy gapping
- finally, with both volume and rsi, we see negative divergence with price

- green circle shows bounce off of short term trend line; however, the red circles highlight falling below that line and then 2 failed attempts at breaking back above it before gapping down
- the purple circles show new high on horrible volume
- don't forget the crappy gapping in the blue circle
- and finally don't forget your negative divergences

07 March 2007
excited about a couple things tonight!
the indexes posted ugly candles today. for most of the day, up until about 3:19pm, in fact, everything looked pretty good. however, as you know, they all closed lower than they opened. keep this in mind too - volume again was relatively low, just like yesterday. that means that for like 99% of the day the markets were up on light volume. who was buying? did the volume pick up as the indexes dropped for the last 40 minutes? i am not sure.

- i am also excited because i got tim knight's new book in the mail today. i have learned a lot by frequenting his blog, so naturally i have high expectations for this new piece of literature.
- finally, i am going to see the band clinic tonight - should be a great show, and i just found out that it's sold out. hopefully the bar won't be too crowded...

06 March 2007
so far, so... so not convincing?
the markets were strong today - it wasn't surprising - they were overdue for a bounce, and the previous day's failed attempt along with the asian markets rallying overnight triggered some buying or covering, or both. the absolute and % gains for the day on the indexes were impressive. but what about the volume? i compiled a graphic below showing the last 23 days or so on the three major indexes. today's gains (retracing) were accomplished on the lowest volume since last tuesday's plunge. is this buying with conviction or shorts protecting profits? or something else? who knows? who cares? i am believer in paying attention to price and volume. big gains with big volume tend to stick as so big losses with big volume. big gains or losses on little volume tend not to stick, or rather to be be less indicative of what lies ahead. the same goes for breakouts, breakdowns and any other big moves.
the real question then becomes: what does today's action say about the short term? well, anything can happen tomorrow - but for the moment i the prospects of more significant downside remain. and as for getting through tomorrow, i'll be looking at the stocks that were relatively weak today despite the observed market strength [see this post].

the real question then becomes: what does today's action say about the short term? well, anything can happen tomorrow - but for the moment i the prospects of more significant downside remain. and as for getting through tomorrow, i'll be looking at the stocks that were relatively weak today despite the observed market strength [see this post].

Subscribe to:
Posts (Atom)