18 April 2007
RIG stopped in its tracks?
i haven't check other oil services stocks, but this may turn into a good short... will continue to monitor.


16 April 2007
v o l u m e
i try to observe stock trading volume in an attempt to judge the relative strength, weakness, conviction, etc of particular price movements, especially when these movements occur close to support, resistance and trend lines. that's why i will be checking out this article:
Volume, the Mysterykeep reading here.
By Nigel Hawkes, President, Hawkeye Traders
Many thousands of words have been written on volume over the years, but its secrets elude many traders. Until a trader has a full understanding and appreciation of volume, though, it is my considered opinion that he or she will be making judgments that do not take into account the basic “supply and demand” of the market...

15 April 2007
BWLRF - requested chart
the first chart of BWLRF shows the stock for the last 6 months. the blue box highlights the very recent break above the 1.84 horizontal resistance on big volume. this looks pretty bullish to me. the ascending rsi and sto seem to indicate strength over this same period. holding this new level will be key.

the next chart below shows the BWLRF's entire history. from this chart we can see that the $2 is critical too. this stock topped out at $2 when it first debuted. then, as the red box on the left side of the chart highlights, the stock broke out above its ipo highs but only briefly. just now its retesting this $2 level. as the shorter term chart above indicates, it looks strong. breaking above $2 on big volume will be key for not breaking down again.


the next chart below shows the BWLRF's entire history. from this chart we can see that the $2 is critical too. this stock topped out at $2 when it first debuted. then, as the red box on the left side of the chart highlights, the stock broke out above its ipo highs but only briefly. just now its retesting this $2 level. as the shorter term chart above indicates, it looks strong. breaking above $2 on big volume will be key for not breaking down again.

11 April 2007
if you got'em, make your chart requests
i am too busy and exhausted to be authoring blog posts these days, but it's only temporary. however, for the time being, please feel free to request a chart analysis for any stocks of interest. i can find time to do that. thanks and keep it real!
08 April 2007
the approaching moments of truth: spx
i have to apoligize to my faithful readers - for a couple reasons i have not been posting as much as i would like to... for one, i have been busy with a home renovation that has gone on too long and we are nearing the end and its coming along great but it has been eating up a lot of my time lately. on top of that, the markets have been strong, and i've been letting the charts "breathe" so to say in an attempt to gain some insight about what comes next. that being said, the markets and the charts have been showing strength, and not much out there impresses me in terms of shorting. i am not fighting the the trend, or lack of it, and have been focusing then on the house and my day job. this next week will be interesting. i have two charts of the SPX for us to look at.
this first chart is a longer term view of the SPX and a major trend line highlighted in blue. we've fallen below it for a second time now. retracing to this line and busting above with volume indicates strength and would suggest perhaps more upside for some time to come. a retrace on low volume with no busting through or a busting through accompanied by a subsequent breakdown may be an additional red flag signaling the making of a top for some longer duration beyond the short term. the red circle highlights our approach up the underside of the blue uptrend line.

below is a shorter term view of the SPX. the last candle pictured is the thursday before the easter holiday - the low volume makes sense. monday and the reaction to friday's strong job numbers will start the week out with a bang. the strong job numbers suggest economic strength - i am no economist, but i imagine that low unemployment is bullish for a consumer-driven economy; however, strong numbers won't inspire the fed to cut rates. tight labor markets aren't necessarily good for company profits. anyway, back to the charts. check'em out and let me know if you have any thoughts.

this first chart is a longer term view of the SPX and a major trend line highlighted in blue. we've fallen below it for a second time now. retracing to this line and busting above with volume indicates strength and would suggest perhaps more upside for some time to come. a retrace on low volume with no busting through or a busting through accompanied by a subsequent breakdown may be an additional red flag signaling the making of a top for some longer duration beyond the short term. the red circle highlights our approach up the underside of the blue uptrend line.

below is a shorter term view of the SPX. the last candle pictured is the thursday before the easter holiday - the low volume makes sense. monday and the reaction to friday's strong job numbers will start the week out with a bang. the strong job numbers suggest economic strength - i am no economist, but i imagine that low unemployment is bullish for a consumer-driven economy; however, strong numbers won't inspire the fed to cut rates. tight labor markets aren't necessarily good for company profits. anyway, back to the charts. check'em out and let me know if you have any thoughts.

04 April 2007
half and half
i am impressed as any permabull out there as to the price action in the dow yesterday - it moved up nice, held its gains, and then closed above resistance. however, check out the volume in the chart below. just because volume wasn't awesome doesn't mean that the dow won't continue higher, but it's just one thing to keep in mind. i've been busy hanging drywall lately, so i haven't had much time to post here. but that's changing soon. i have some good charts lined up.


28 March 2007
so far so good on QID
intraday post | the QID remains above the uptrend line that i pointed out a couple days ago...


26 March 2007
ACI and the upcoming downtrend line test
it looks like ACI will soon be testing the underside of a relatively long term downtrend line. i don't know much about the fundamentals of this sector, but could spring/summer be a good time to short coal? who knows - i'll be keeping an eye on the chart, price and volume, moving averages and this downtrend line.


X and steel
i noticed this chart over the weekend. check out the negative divergence between price and rsi, even at barely new highs... volume at these new highs is weak too. now today, monday, it gapped up at the opening. if volume is big today and x closes at new highs, that would be very bullish. volume sucks and/or it closes weak, keep an eye on it for short. also, there may be buyout rumors circulating in the steel sector in general.


25 March 2007
s&p and trend line retracement test
the SPX is retracing to the underside of a relatively long term uptrend line (see red circle). will we see new highs here?


22 March 2007
good time to watch QID
now seems like a good time to keep any eye on the QID. it has pulled back to the upside of the red downtrend line. it may or may not find support here. also, keep an eye on volume.


RVBD, price and volume, and when to cover or at least not be bearish anymore
intraday post
this chart of RVBD and the red box highlights consolidation (kinda the opposite of distribution) after a multiday fall and big volume capitulation. in the red box we see big volume without the price moving much. lots of shares are changing hands with almost equal buyers and sellers. this is usually a good sign to cover and wait for a low volume bounce to a critical resistance line. in the red box we also see a tag of the blue uptrend line - this provided support too. that's why i like trendlines - when things come together like this, which they often do, you can get a good idea about what is going to happen.

this chart of RVBD and the red box highlights consolidation (kinda the opposite of distribution) after a multiday fall and big volume capitulation. in the red box we see big volume without the price moving much. lots of shares are changing hands with almost equal buyers and sellers. this is usually a good sign to cover and wait for a low volume bounce to a critical resistance line. in the red box we also see a tag of the blue uptrend line - this provided support too. that's why i like trendlines - when things come together like this, which they often do, you can get a good idea about what is going to happen.

21 March 2007
BOOM chart update
BOOM - there's not a whole lot to grip on to here - but that may just be me. others may see a whole lot more. i am thinking that maybe the blue lines are highlighting the beginning of a downtrend channel with the current price at about the middle of that channel. the dashed blue line shows the short term uptrend - longs won't want to see that violated. volume is low. but do check out the purple box - i drew this for a couple reasons. notice how the rsi became oversold here but the price could not beat the most recent high as highlighted by the horizontal red line. that is bearish to me. on the day that the most recent high was achieved, a high number of shares traded hands, and the stock closed weak and continued down after that - this indicated distribution to me (high volume but not much stock movement at the top). otherwise it's meandering above the 50-day moving average and below the 200-day moving average. see something i missed?


ESRX and divergences
intaday post
ESRX is at resistance, and price (as it beats recent highs) is negatively diverging with rsi, slow stochastics, and macd and macd histogram. bulls got volume in their corner. one to keep an eye on.

ESRX is at resistance, and price (as it beats recent highs) is negatively diverging with rsi, slow stochastics, and macd and macd histogram. bulls got volume in their corner. one to keep an eye on.

20 March 2007
third circle to the rescue - HAL and the power of trend lines
intraday post
these two charts of HAL demonstrate the power of trend lines and trend line support. it's significant when these trend lines get broken - so keep monitoring this one. check out the volume for today so far, too!
HAL - longer term - third circle to the rescue!

HAL - shorter term

these two charts of HAL demonstrate the power of trend lines and trend line support. it's significant when these trend lines get broken - so keep monitoring this one. check out the volume for today so far, too!
HAL - longer term - third circle to the rescue!

HAL - shorter term

19 March 2007
short watch list
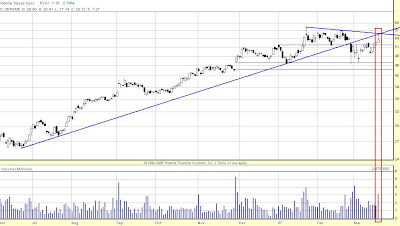
today's volume sucked... it's late, here's my watch list for tomorrow - let me know if you have any questions about why these are short candidates or what i am waiting for before i actually go short...
ATHR

BBD

ENER

JBHT

JOYG

LRCX

MBT
ATHR

BBD

ENER

JBHT

JOYG

LRCX

MBT

16 March 2007

15 March 2007
friday watchlist, railroads and click to get big
update friday 11:53am - call on railroads not working out bad so far...
hmm, i am a little surprise today at the lack of volume and follow through today in the markets considering the blast up we experienced yesterday. maybe it will come tomorrow/friday. at any rate, it doesn't say much for the bulls. that's why the watchlist i am presenting tonight is dominated by short candidates. big surprise, right?

NVDA - the red box here highlights the candle and volume from wednesday march 14 when we saw such strength and volume in overall market. the volume here isn't so bad, and the price action is horrible. NVDA is now trading under its 200-day moving average.


and finally i am going to present 3 charts of railroad stocks. they too are were lame relative to the overall markets. they have enjoyed a nice run up over the last many months so maybe it's time they give back some of those gains.


hmm, i am a little surprise today at the lack of volume and follow through today in the markets considering the blast up we experienced yesterday. maybe it will come tomorrow/friday. at any rate, it doesn't say much for the bulls. that's why the watchlist i am presenting tonight is dominated by short candidates. big surprise, right?
AAPL - watch to make sure how AAPL opens up and behaves relative the red highlighted resistance line and the thin blue uptrend line... also notice the decreasing volume.


ATHR has fallen below the blue highlighted trend line and has retraced to its underside.

NVDA - the red box here highlights the candle and volume from wednesday march 14 when we saw such strength and volume in overall market. the volume here isn't so bad, and the price action is horrible. NVDA is now trading under its 200-day moving average.

NYX - this stock is no stranger to us... again pay attention to the red box highlighting wednesday's and thursday's action - not so hot compared to the rest of the market...

and finally i am going to present 3 charts of railroad stocks. they too are were lame relative to the overall markets. they have enjoyed a nice run up over the last many months so maybe it's time they give back some of those gains.
BNI

CSX

UNP

RVBD - intraday chart
update - RVBD has kept going down all day...
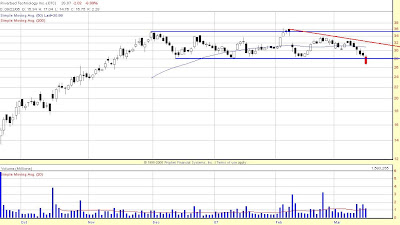
RVBD dropped out of its trading range today... check back with it at the end of the day to see where it closes and the final volume tally. see all RVBD posting charting here.
RVBD dropped out of its trading range today... check back with it at the end of the day to see where it closes and the final volume tally. see all RVBD posting charting here.

Subscribe to:
Posts (Atom)